Flow · auto-gatedCD8⁺ T cells
—Hover the plot: each cloud of dots is a cell population. BioStudioAI drew the gate around the CD8⁺ T cells — drag it to adjust.
Click around a working copy of the app: report, slides, figures, tables, notebook and more, made from one demo plate with the statistics computed live. Then watch a plate go from file to approved summary.
Click around — this works like the real app. Every report, figure, table and app view below was made by BioAI from one synthetic demo plate, with the statistics calculated live.
 BioStudioAI / IL-6 screen / Report
Hover the plot: each cloud of dots is a cell population. BioStudioAI drew the gate around the CD8⁺ T cells — drag it to adjust.
Hover the curve: dots are the measured responses, the line is BioStudioAI's 4-parameter fit. Drag the handle to try another EC50.
Hover a dot to see the gene. Blue dots on the right are switched up, cyan on the left switched down; grey changed too little to count.
Hover an axis to compare a cytokine between vehicle and treated samples. Further out = more of it.
Hover any well in the raw export to see the row it became — or hover a row to find its well.
Hover a step or a row for the detail behind it.
The other six checks — parsing, coverage, duplicates, units, batch drift, instrument flags — passed quietly.
| What QC changed | With QC | Without |
|---|
Four sample projects, each generated end to end from one raw instrument file — figure, report, QC, study design, a narrated film and a live presentation you can question. Simulated data, real output.
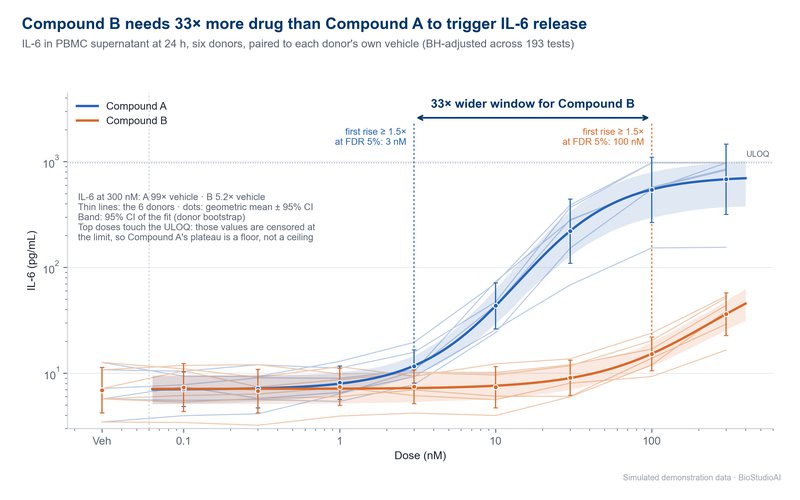 Headline figureAuto-generated
 Headline figureAuto-generated
 Headline figureAuto-generated
 Headline figureAuto-generated
You drop the file. BioStudioAI does the rest. You approve.
Ten stages run on their own in about four minutes on the demo plate. Here is what happens in each, what you can change, and what you get. Click a stage, or let it play.
Header blocks, several plates per sheet, merged cells, instrument XML and XLSX — straight from the instrument, no tidying in Excel first.
Standards, blanks, controls, samples and replicates are recognised from the layout and the names.
Replicate CV, recoveries, blanks, range, saturation and drift — before any statistics.
Each flag carries the rule, the value and the action taken. Nothing is dropped silently.
4PL or 5PL, LLOQ and ULOQ, dilution factors applied; IC50, EC50 and R² from the fit.
Replicates, pairing and multiple comparisons handled — from 13 methods, with the reason shown.
From 38 native plot types — live, editable, ready for publication.
From computed values only: the AI never types a number, and every number links to its calculation.
With the real plots, not screenshots — plus a live webpage and a narrated presentation.
Saved to the project and the notebook. Next plate: one click with Run again.
This console is analysing a demo ELISA plate right now, in your browser — plate map, QC, curve, statistics, summary, report. You drop the file, read the summary and approve. Everything in between is BioStudioAI's job.
Straight from the instrument. No tidying in Excel first.
A few sentences, every number linked to the calculation behind it.
Every gate, fit, threshold and exclusion stays editable.
That's it. The rest of the morning is yours.
Header blocks, several plates per sheet, instrument XML and XLSX.
Standards, blanks, controls, samples and replicates.
Replicate CV, recoveries, blanks, range, saturation, drift.
The rule, the value and the action — undo in one click.
4PL / 5PL, LLOQ and ULOQ, dilution factors applied.
Replicates, pairing and multiple comparisons handled.
Live, editable and ready for publication.
From computed values only — the AI never types a number.
With the real plots, not screenshots.
Saved to the project. Next plate: one click with Run again.
Hands-off doesn't mean out of control. Scientists still design the study, review the summary and make the call — BioStudioAI removes the copy-paste in between.
An automatic run can be undone in one click; so can each change you or BioAI make.
BioStudioAI prepares; you approve. Results reach the project and notebook only when you say so.
Gates, fits, thresholds and exclusions are yours to change — the numbers update everywhere.
Change the analysis and older text is flagged as out of date, instead of quietly staying wrong.
“Log scale.” “Only donor 2.” “Bigger text for slides.” BioAI edits, and the change is logged.
Same assay, new plate: one click applies the same steps, so results stay comparable.
Each studio does one job well, and they pass data to each other: a plate analysed in the parser lands in the report, the notebook and the slides without an export.
52 instruments and formats, each assay's conventions built in.
Open Why BioStudioAI12 reasons, with proofEvery claim linked to a test, a certificate or a sample you can open.
Open SavingsWhat the old way costs19 tools, $11,309+ in licences per user, and a calculator for your lab.
OpenSend an export from your instrument; we'll show you the report it makes.
We'll reply to your work email, usually within minutes.